Performance Metrics Framework - Types of Metrics
The Archibus Performance Metrics Framework lets you define and calculate metrics that measure aspects of your portfolio and let you monitor your management processes over time. Metrics are not just a management tool; organizations often use metrics as part of change management programs in which they compare their organization to specific key-performance indicators that measure progress towards strategic organizational goals.
Archibus presents different types of performance metrics in several different interface controls.
Analysis Metrics
Analysis metrics calculate strategic analysis values. Like tracking metrics, analysis metrics are defined in the Metrics Definitions table (afm_metric_definitions) and can have trending directions and warning levels. However, unlike tracking metrics, analysis metrics:
- are intended for strategic analysis and are typically on a yearly granularity, or they forecast multi-year conditions, such as 3-Year NPV or lifetime IRR.
- can include both past performance, such as actual energy consumption, and future values, such as estimated energy consumption for future years.
- are not displayed on home pages, but are displayed by a view, which can provide interactive filtering.
- are not processed by the Metrics workflow rule, and their values are not saved to the Archibus Metric Trend Values (afm_metric_trend_values) table. Analysis metrics are updated using the Update Analysis Metric action accessed from the Aggregate and Forecast Costs task available from the Strategic Financial Analysis application.
The Strategic Financial Analysis application's Financial Analysis Console, and Assets application's Asset Lifecycle Console (Optimization tab) display analysis metrics.
The Strategic Financial Analysis application comes with analysis metrics. Deployments that wish to add their own analysis metrics, or adjust the definitions of existing metrics, must purchase the Archibus Performance Metrics Framework separately, and can then use the Define Analysis Metrics task to make the adjustments. See User Help topic, System / Add-In Manager / Define Analysis Metrics.
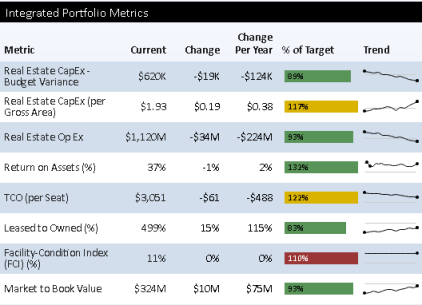
Process Metric Scorecard
This presents a set of trending metrics grouped into a scorecard.
Trending Metrics
Trending metrics are metrics that are useful to track over time, such as those metrics that measure the effect of your energy consumption over time. These metrics are processed by the Metrics Collection workflow rule.
Ratio Metrics
A particular type of trending metric is the ratio metric. Ratio metrics compare one metric, such as Energy Consumption, divided by another metric, such as Gross Area. Ratio metrics are often more telling than metrics on a single value, since they normalize out irrelevant factors. For instance, Rentable Area will naturally rise and fall with the size of facility managed. However, Area per Occupant is a ratio that measures the effectiveness of your space management efforts regardless of changes in the portfolio. Because they are independent of the size of the section of the portfolio being measures, ratio metrics are also useful for drilling down into data by building, business unit, and so forth. You can compare different organizations against each other or against a target value because the ratio metric is independent of the differences in their size.
Stoplight Colors
The scorecard controls use "stoplight colors" to indicate performance. These colors are green for "on target", yellow for "warning" and red for "critical" ranges. For metrics that are counts and sums, you can scale the report targets in the metric definitions to the size of your portfolio or organizational processes.
If you drill-down into a metric, the program only displays the stoplight colors for ratio metrics. The reason is that only ratio metrics will scale with the size of each drill-down category (business unit, site, etc.). The target that you established for the overall metric does not have meaning for an individual drill-down category. (If you wish, you can establish a different metric for each geographic region, business unit or site if they are measuring towards particular performance targets. However, often, you can handle all granularities with a single ratio metric.)
Direction of Metric Trends
Metric definitions also have a trend direction to indicate what the desired direction of change is. There are several options for trend direction:
- A "Smaller is Better" trend is used by metric definitions on values such as Operational Expenses, which are to be minimized.
- A "Larger is Better" trend is used by metric definitions on values such as Customer Satisfaction, which are to be maximized.
- An "On Target is Better" trend is used by metric definitions such as Space Occupancy Density, that should stay within an optimal range to support business activities.
Each metric definition has a series of high and low target ranges and colors the metrics results with the stoplight colors based on the trend direction.
Each metric definition also has a Report Target value. This is the value the Process Metric Scorecard uses as the horizontal registration line in the sparkline chart and as the target in the "% to Target" bar chart.
Some metrics, such as number of Buildings, are just facts. An increase or decrease may not have any particular significance to the organization's strategy. In this case, you can use the "No Significance" as the trend direction, and the program will not display any stoplight color or "% to Target" bar chart.
Report Trend Direction
The enum values for Report Trend Direction field in the Archibus Metric Definitions table (afm_metric_definition.report_trend_dir) are:
Smaller is better (0)
-
If value increased, then shows Red Up Arrow
-
If value decreased, then shows Green Down Arrow
Larger is better (1)
-
If value increased, then shows Green Up Arrow
-
If value decreased, then shows Red Down Arrow
On Target is better (2)
-
A “Good Change” is defined as a change that brought the value closer to the target:
-
value < reportLimitTarget and value increased
-
OR value > reportLimitTarget and value decreased
-
- If the value got closer to the target, then
if value increased, then shows Green Up Arrow
if value decreased, then shows Green Down Arrow
-
If the value got further from the target, then
-
if value increased then shows Red Up Arrow
-
if value decreased, then shows Red Down Arrow
-
No Significance (3)
-
If value increased, then shows Blue Up Arrow
-
If value decreased, then shows Blue Down Arrow
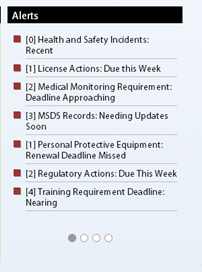
Metric Alerts Scorecard (Counts)
This presents a set of metrics that count conditions, typically actions that you or your staff need to take. The scorecard highlights those actions that need immediate attention or that have reached a high threshold that indicates that there is something wrong with the organizational process that manages that type of action.
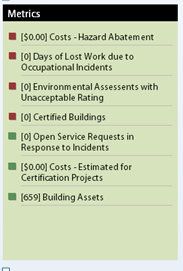
Metric Values Scorecard
Some values that you want to measure do not represent trends or immediate actions, but you want to know in order to get a sense of the scope of your entire organization. The number of buildings or of LEEDS-certified buildings is one example. Number of Days Lost to Occupational Incidents is another.
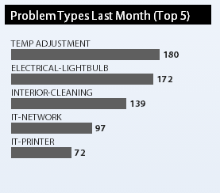
Metric Values Chart
In some cases, you want to give top-level attention to the outliers -- for instance the top problem types, business units, or buildings -- since these outliers deserve more of your attention. In this case, you can use a metric values chart.